|
NeuroGuide
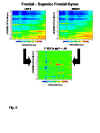
computes the Pearson Product Correlation Coefficient (-1 to +1) with respect to
a 3-dimensional Region of Interest (ROI) and the remainder of the 2,394 LORETA
Gray Matter Pixels over the time span of selected EEG and then displays the
results in the LORETA Viewer (Launch the NeuroGuide demo then click Help >
NeuroGuide Help > NeuroGuide Manual > Appendix-G). The ROI is
identified by either an Anatomical Name or by Brodmann Area. The
average current sources of the ROI are used in the computation of the
correlation coefficient and the ROI correlation to itself = 0 in the LORETA
Viewer.
Click
here for details:


Contact us for more information
| 